An internet resource developed by
Christopher D. Green
York University, Toronto, Ontario
ISSN 1492-3713
(Return to index)
[p. 69] IX
CURVES OF PHYSIOLOGICAL PROCESSES COMPARED WITH CURVES OF MENTAL AND MOTOR PERFORMANCE
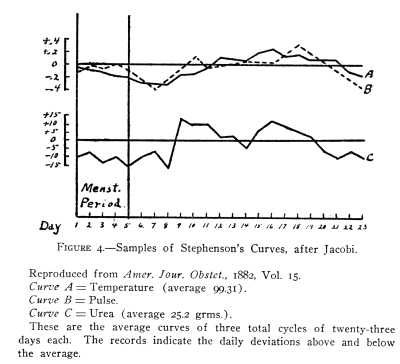
In 1882 Stephenson [1] published a number of curves platted from Jacobi's figures, which he analyzed according to a method fully set forth in his article on the subject. Jacobi's records comprised observations on temperature, pulse and the excretion of urea. These curves are reproduced in Figure 4, page 78.
The line O represents the course which would have been followed by the functions measured if they had not fluctuated, but had maintained the average straight across the month. When the curve dips below the line 0, the function measured falls lower than the average; when the curve rises above, the function is above the average. The curves begin on the first day of the menstrual period. Of the two curves platted along the same average the solid line represents temperature and the broken line pulse.
The curves indicate in a fairly uniform way a fluctuation within each month, and both Jacobi and Stephenson connect this fluctuation with menstruation as a cause, or at least as a closely related and coincident phenomenon. The chief criticism on these data is that no control records were taken on men of the same age and same general condition in life, to determine whether this fluctuation in vital functioning is peculiar to women. In a general way these curves by Stephenson agree with Van Ott's curve, Figure 12. Van Ott [2] also found that the highest [p. 70] point for physiological functions was reached just before menstruation. A quotation from his address delivered before the International Congress in Berlin in 1890 follows:
"In addition to researches on temperature, pulse, blood pressure (Basch spygmanometer), we undertook to make pioneer experiments on caloric radiation, muscular force, pulmonary capacity, inspiration and expiration, and on the state of the nervous system, using the reaction time of the tendinous reflex."The experiments are described separately thus:
"1. Caloric Radiation. -- The experiments were made on 4 women, comprising 10 periods. The thermofugostope of Arnshen was used. The tests were always made at the same point on the chest.In summing up the results of his experiment Van Ott says, "We found that the energy of functions of the female organism is augmented before the beginning of menstruation, and diminished immediately before or with the onset of the hemorrhage.[p. 71]"2. Muscular Energy. -- 16 women and 20 menstrual periods. Measurements made with both hands with the Collin dynamometer (with 2 pointers).
"3. Vital Capacity and Vital Force. -- 19 women and 19 periods. Hutchinson spirometer and Waldenburg pneumometer.
"4. Reaction Time of the Tendinous Reflex of the Knee. -- 4 women and 4 menstrual periods. Experiments performed by means of a small hammer especially invented for researches of this kind by Dr. Daniel. (See 'Séances et Memoirs de la société de Biologie,' 1882, p. 595.)"
"I will not tire you, gentlemen, with a recital of the details and the enumeration of all the figures, for these will be given in a work much more considerable on this subject."
Unfortunately this promised book never appeared, so far as the present writer is able to discover, and no figures whatever are given in this address. We are not told who were his subjects; whether they were women in the hospital or women who were perfectly well, and normal as to menstruation; whether they knew the purpose of the experiment, or were naïve, For these several reasons it is impossible to examine and analyze Van Ott's data, for purposes of comparison with the present study. The curve which he constructed (Figure 12) is a mere schematic presentation of the general drift of the results ("ce schema répresente le type des oscillations"), and is not platted from any actual figures. Moreover it represents the combination of all four experiments, and it is therefore not known what happened in the case of any individual test; though the author does state that the excitability of the nervous system reaches its climax during menstruation, and that the same is true of caloric radiation. In the light of these last two statements it is somewhat difficult to understand how his "schema" comprising all four tests can indicate such a great drop during menstruation, since in two of the tests the curve reaches its climax at that time. In short, it is regrettable that the data collected by Van Ott are not available.
Clelia D. Mosher,[3] working over ten years later than Van Ott, took daily records of blood pressure on women and men, thus avoiding an error of previous investigators, who neglected to use as a control human beings not subject to the phenomenon in question. Dr. Mosher's experiment is quoted as follows:
"Method. -- Daily records of the blood pressure were made on 14 persons, -- 9 women and 5 men. The women were selected as representing normal conditions of menstrual health. The men were all healthy adults, and four were athletic. An attempt was made to continue the record long enough to cover at least two periods of change in pressure;[p. 72] in some cases the observations extended over 49 days. . . . The blood pressure records were made with the spygmanometer of Mosso. The tracings were taken daily at the same hour, and under uniform conditions, perfect relaxation being secured and all variable factors excluded as far as possible.Mosher gives no figures and no curves. This article was published as a preliminary report, but, so far as the present writer is able to discover, no subsequent publication of data has been made. It is thus impossible to compare the records in any definite way with the figures of the present study."Conclusions. -- That a rhythmical fall of blood pressure, at definite intervals, occurs in both men and women. The daily records of the with the spygmanometer of Mosso on both men and women under similar conditions of life and occupation give curves apparently indistinguishable in character. The fall in pressure in women occurs near or at the menstrual period. In all of the 14 series of records the fall of blood pressure was gradual from the mean average pressure. This from day to day shows oscillations within rather definite limits. The maximum fall of pressure may extend over two or three days and the corresponding rise to normal average pressure is gradual. There is usually a preliminary rise, above the normal average pressure; this occurs from 3-5 days before the onset of the main fall of pressure, which constitutes the principal feature of the rhythm. In every case there was a preliminary fall, abrupt and definite, but usually not so extensive as the main fall of pressure; this preliminary fall was followed by a return to the normal or higher pressure, before the principal fall occurred. In 4 cases there was a distinct rise above the normal after the main fall of pressure, before the return to the normal daily oscillations. These variations were not peculiar to either sex."
The fact that the fluctuating curves of the women subjects were "apparently indistinguishable in character" from those of the men subjects gives rise to the question, whether the fluctuations found by Mosher and previous investigators are to be connected with menstruation as a cause. This, it may be added, is a point which seems to have escaped nearly all writers who have quoted Mosher.[4][p. 73]
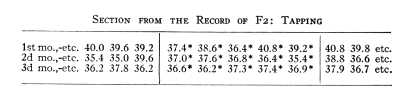
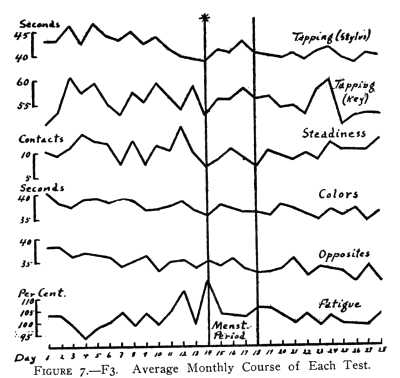
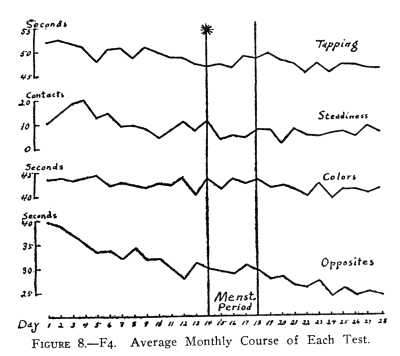
To obtain from the present study curves of mental and motor performance which would be comparable with those platted for physiological functioning, the following method was used. Because of the great amount of practice during the first thirty days, which when superimposed upon records for the other months, would skew the curve, the first four weeks of work for each subject were thrown out. This left the record of two menstrual periods for F1, of three menstrual periods each for F2 and F3, and of one menstrual period for F4. The figures for each test for each individual were then arranged in columns, with the five days of the menstrual period at about the center of the series, as in Van Ott's curve, thus:
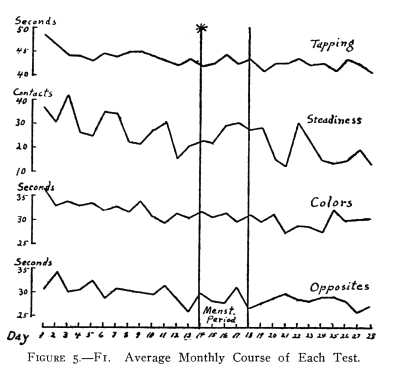
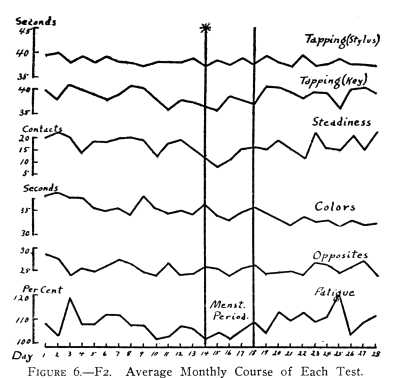
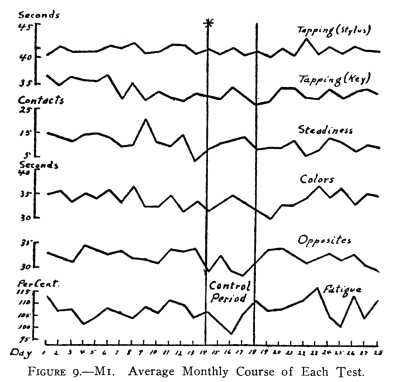
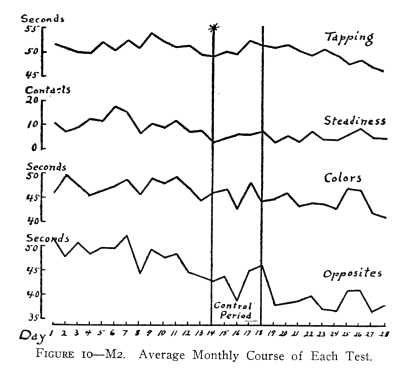
The result agrees in no case with the curve of Van Ott (Figure 12). Nothing like a "wave" is discernible. The curves pursue their course straight across the month, with the familiar irregular variations which are characteristic of all curves of mental and motor work. The curves of M1 and M2 (Figures 9 and 10), platted in the same way as those of the women, from chance series of 28 days each, yield results characteristically differing in no way from those yielded by F1, F2, F3, and F4.
In order further to mass the data it was desired to combine the curves of the four women [5] in each test, i. e., to determine [p. 74] the composite curve of F1, F2, F3, and F4 (1) in tapping, (2) in steadiness, etc. It is evident that in order to effect a proper statistical synthesis of these records it will be necessary first to reduce the records of the three individuals to a common ratio. It will not be productive of reliable results to make use of absolute amounts, as was done when the individuals were considered each by herself. This fact becomes at once clear when we take up a sample from the records. In the steadiness test, e. g., the averages for the first day of the series run thus; respectively: F1 -- 37.0 (contacts), F2 -- 20.0 (contacts), F3 -- 9.3 (contacts), F4 -- 5.0 (contacts). Now, if these four absolute amounts be averaged to obtain the combined curve, it is seen that F1 will have nearly twice as much influence upon it as F2, and four times as much influence as F3, etc. Thus F1 will determine the shape of the curve, merely because she as an individual is much less steady than any of the other subjects; whereas F3, whose record is the most reliable of the four, because it includes the greatest number of trials, will have but little influence in determining the shape of the composite curve, merely because she as an individual is four times as steady as F1, and twice as steady as F2. This principle is applicable in all the tests (except for fatiguability, where the records are already in terms of per cent). For instance, in color naming the slowest person will exert more influence on the composite curve than the most rapid person, merely because her record will be greatest in absolute number of seconds. F1 is like herself from time to time, but unlike F2, F3 and F4 in the traits here measured; F2 is like herself, but unlike F1, F3 and F4, and so forth for the other subjects. Therefore absolute amounts may be averaged to determine a composite curve for a single individual in a single trait; but absolute amounts may not be used to determine a composite curve for many individuals in a single trait.
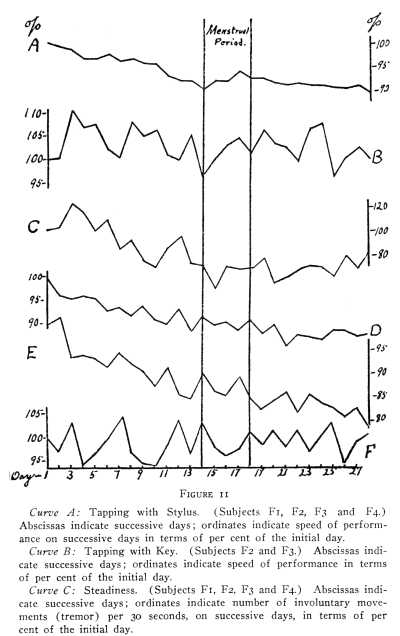
This was the method of combining the curves. The averages for each individual for each test, used in platting the curves found in Figures 5, 6, 7 and 8 were taken. Each figure was reduced to a per cent of the first figure in its series. Thus, for example, the record of F1 in steadiness, which in absolute amounts runs 37.0, 30.5, 42.0, 26.0, etc., becomes 100.0, 82.4,[p. 75] 113.4, 70.3, etc.; the record of F2 for steadiness, which in absolute amounts runs 20.0, 21.5, 19.3, 12.3, etc., becomes 100.0, 107.5, 96.5, 61.5, etc.; the record of F3 for steadiness, which in absolute amounts runs 9.3, 8.3, 10.2, 13.31, etc., becomes 100.0, 89.3, 110.0, 141.o, etc.; the record of F4, for steadiness, which in absolute amounts runs 5.0, 4.0, 7.0, 6.0, etc., becomes 100.0, 80.0, 140.0, 120.0, etc. These records may now be combined into a curve on the shaping of which each individual exerts an equal fraction of influence. In this curve all individual differences will tend to be equalized, all accidental differences will tend to disappear; and ii there be a genuine characteristic effect produced by a phenomenon to which all the women are thus made simultaneously subject, that effect will tend to emerge and lend itself to clear definition. The curves thus platted are found in Figure 11.
These curves (except fatiguability) are all slightly inclined downward from the first of the month toward the last, because of practice. To consider them one by one: Curve A (Tapping with the Stylus) shows no effect due to menstruation, except that the record which falls on the first day is equalled only once again during the 28 days, and that on the 28th day, after 14 days of practice which, as may be noted, brings the whole curve gradually downward. This apparent effect is in all probability, however, due solely to chance. Otherwise the curve proceeds straight across the period and across the month with the familiar irregularities indistinguishable from those found in the curves of M1 and M2. Curve B (Tapping with the Key) follows the irregular course of the ordinary practice curve. It is more irregular than Curve A because it is composed of the records of but two individuals (F2 and F3). Curve C (Steadiness) shows that the subjects were very steady en the first two days of the critical period. The record of the second day is the steadiest of the 28. These conclusions regarding a genuine characteristic effect on any day are, however, to be advanced with much caution. The curves of M1 and M2 also show "lowest points," as for example, in M1's curve for steadiness the day preceding the pseudo-critical period is distinctly the best record of the 28, and if it occurred on the curve of the women might well be said to indicate maximum steadiness on the day preceding menstruation.[p. 76]
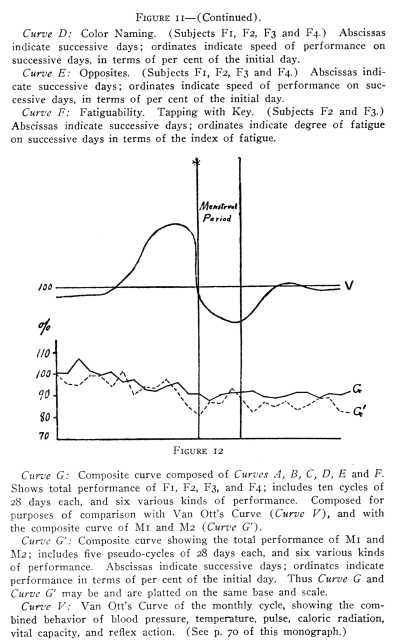
The curves for speed and accuracy of perception (Curve D), for controlled association (Curve E), for fatiguability (Curve F), show no extraordinary deviations whatever during menstruation. The curves proceed as the ordinary practice curve does, slightly inclined downward, and suggesting neither remarkable inferiority nor remarkable superiority of performance on the first day nor any other day of the critical period. No clear and valuable result would be expected from averaging all curves for all individuals for all tests together to determine the presence of a "cycle" or "wave," because there is no reason to assume that if menstruation exerted a real influence upon the processes here measured, that influence would be the same on all processes. For instance, menstruation might cause a subject to tap more rapidly, but to associate more slowly, and thus a real "wave" might be established in each of these processes. But to combine them would obviously just equalize the differences, and obscure the form of the "wave." However, a total curve composed of Curves A, B, C, D, E, and F was platted for purposes of comparison with Van Ott's Curve, which purports to show the combined behavior of several physiological processes. (See Figure 12.) This composite curve is designated as Curve G and is found in Figure 12, running beneath Van Ott's "schema." Each point on it is the average of 66 figures.
Van Ott gives no satisfactory account of the statistical treatment of his figures. He does not give any mathematical demonstration of his results, leaving these, as he says, for a subsequent publication, which was never made. Consequently it is impossible to compare his curve and Curve G unit for unit. Indeed it is not at all clear that Van Ott's curve is mathematically true in any sense, even in the preservation of relative proportions. Nevertheless Curve G is given graphically in company with Van Ott's curve. It is at once evident that the only consistent tendency which Curve G shows is the slight gradual descent due to practice between the first and last of each month. It is not uninteresting to observe that the figure indicating greatest average efficiency in all tests chances to fall, as a matter of fact, on the second day of the critical period.
Curve G' is a composite curve showing the total performance of MI and M2 for four pseudo-cycles (3 cycles for M1 and 1 cycle for M2) Of 28 days each, in six various kinds of work.[p. 77] The averages used in platting Figures 9 and 10 were converted into per cent of the initial day in each test, exactly as in the case of the women, and then were combined into a total curve which corresponds exactly to Curve G, and is comparable with it unit for unit. Curve G' thus may be, and is, platted on the same base and scale as Curve G. (See Figure 12.) We have now a graphic presentation of the monthly curve of work for the women, as compared with that for the men, and with Van Ott's curve. Curve G follows the same trend as Curve G'; they constantly touch and cross throughout their course. Curve G' is, of course, not so regular as Curve G because it is composed of the records of but two individuals, and accidental differences are not so well equalized. As an illustration of the ease with which the investigator may be led into deducing false conclusions in studies of this kind, note that Curve G' shows a considerable drop just before the critical period. Had this occurred on the curve of the women, the conclusion would have been suggested that this must be ascribed to approaching menstruation as a cause.
It must be concluded that the curves platted for mental and motor performances do not correlate with those previously platted for physiological functioning. An interesting confirmation of the reliability of this conclusion is found in the work of Frederick Lyman Wells.[6] In order to determine the relation of practice to individual differences he experimented with ten subjects. He describes his experiment as follows:
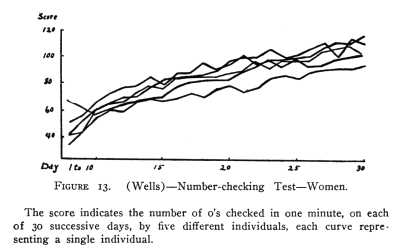
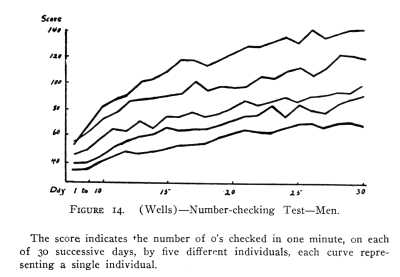
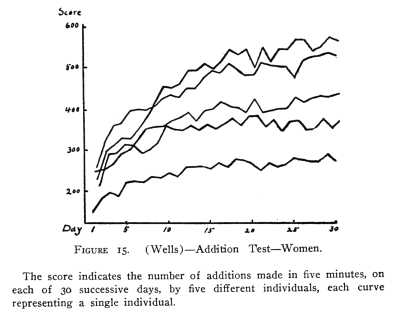
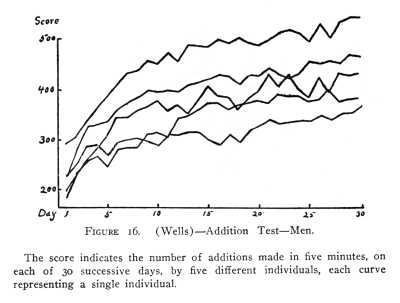
"A group of ten subjects underwent these tests daily, six days in the week, for a period of thirty experimental days. The subjects were nurses in the McLean Hospital, five men and five women, of ages varying from 21 to 35 years. The work performed each day consisted of five minutes of addition, and on the first ten days one record of the number-checking test; while on the succeeding twenty days, five records of the number-checking test were executed each day. The times of day were the same for each subject."[p. 78]The curves from Wells's study are reproduced in Figures 13, 14, 15 and 16. Wells took no note whatever of the occurrence of menstruation in the five women subjects, so we do not know where on their curves these periods fell; and it is impossible to tell by inspection in any case which were the days presumably affected. The curves of the women show no characteristic lapses from efficiency, but are quite indistinguishable in course and form from those of the men, as in the case of the present study.
Notes
[1] Stephenson. On the Menstrual Wave, Am. Jour. Obstet., 1882, vol. 15.
[2] Van Ott, Des Lois de la Périodicite da la Fonction Physiologique dans l'Organisme Féminin, Nouv. Arch. Obstet., 1890.
"Outre recherches sur la température, le pouls, la pression sanguine (spygmanomètre de Basch) nous avons entrepris des nouvelles recherches sur la chaleur rayonnant, la force musculaire, la capacité pulmonaire, la force d'inspiration et d'expiration, sur l'état du système nerveux, en nous bassant sur le temps de réaction des reflexes tendineux." . . .
"1. Rayonnement Calorique. -- Les expériences ont porté sur 4 femmes et 10 périodes menstruelles, pratiquées avec le thermofugostope d'Arnshen; elles ont toujours été faites sur un seul et même point de la poitrine.
"2. Force Musculaire. -- 16 femmes et 20 périodes menstruelles. Mesures prises aux deux mains avec le dynamomètre de Collin (avec 2 aiguilles).
"3. Capacité Pulmonaire et Force de l'Excursion Pulmonaire. -- 19 femmes avec 19 periodes menstruelles. Spiromètre Hutchinson et pneumomètre de Waldenburg.
"4. Temps de Réaction du Réflexe Tendineux dr Genou. -- 4 femmes avec 4 périodes menstruelles. Expériences pratiquées avec un petit marteau inventé specialement pour ce genre de recherches par le Dr. Daniel. (Comptes rendus des Séances et Memoirs de la Société de Biologie, 1882, p. 595.)" . . .
"Nous avons trouvé que l'énergie des fonctions de l'organisme féminin augmente avant le début de la menstruation et diminue an contraire immédiatement avant ou avec de début de l'hemorrhagie.
"Je ne veux pas, Messieurs, vous fatiguer par l'énoncé des détails et par l'enumeration de tous les chiffres, car ils seront relatés dans un travail plus considerable qui parâitra sur le sujet. . . .
"Quoilue j'ai deja dit que ce schema répresente le type des oscillations de toutes les fonctions sur lesquelles ont porté nos recherches, je dois faire observer que l'excitabilité maxima du système nerveux reste parfois un peu au-dessous, tandis qu'elle atteint son summum pendant la menstruation elle même; ceci est confirmé par l'ensemble de tous les cas observés. Il en est de même du rayonnement calorique, qui atteint son maximum pendant l'écoulment menstruel."
[3] Mosher, Normal Menstruation and Some of the Factors Modifying It, Johns Hopkins Hosp. Bull., Apr., May, June, 1901.
NOTE. -- Ellis (Man and Woman, 1909 ed., p. 286) characterizes Van Ott's curve as "the most accurate." Hall (Adolescence, Vol. I, p. 487) also reproduces Van Ott's curve without critical comment, but mistakenly attributes it to Engelmann, who has reproduced it in his work on "The American Girl of Today." (See Bibliography.)
[4] Howell (Text-Book of Physiology, 1908, p. 879) notes that Mosher obtained similar curves for men and women, and suggests that this points to a reproductive cycle in men as well as in women.
F3 had 15 preliminary practice trials previous to Sept. 29.
In platting the curves of F4 individually two menstrual periods are included, in spite of the fact that the first month is much affected by practice, causing the whole curve to take a decided downward slope. In platting the combined curves for all the women subjects, however, only the second menstrual period for F4 is included. These remarks apply also to the pseudo-periods for M2.
[5] The record of F6 is not included in these composite curves on account of the irregularity in the occurrence and duration of menstrual periods.
[6] F. Wyman Wells, Relation of Practice to Individual Differences, Am. Jour. Psych., Jan., 1912, p. 77.
NOTE. -- Wells platted his curves in terms of amount of work done, the time remaining constant; hence his curves showing improvement run upward, while the practice curves of the present study run downward because they are platted in terms of the time of performance, the amount of work remaining constant (except in the steadiness test, and here the practice curve also runs downward because the effort was to do as little as possible, that is, to make as few touches as possible, instead of as much as possible).