An internet resource developed by
(Return to index)
Translated by Henry A. Ruger & Clara E. Bussenius (1913)
CHAPTER IV
THE UTILITY OF THE AVERAGES OBTAINED
Section 17. Grouping of the Results of the Tests
The first question which awaits an answer from the investigations carried out in the manner described is, as explained in sections 7 and 8, that of the nature of the averages obtained. Are the lengths of time required for memorising series of a certain length, under conditions as nearly identical as possible, grouped in such a way that we may be justified in considering their average values as measures in the sense of physical science, or are they not?
If the tests are made in the way described above, namely, so that several series are always memorised in immediate succession, such a type of grouping of the time records could scarcely be expected. For, as the time devoted to learning at a given sitting becomes extended, certain variable conditions in the separate series come into play, the fluctuations of which we could not very well expect, from what we know of their nature, to be distributed symmetrically around a mean value. Accordingly the grouping of the results must be an asymmetrical one and cannot correspond to the "law of error." Such conditions are the fluctuations of attention and the decreasing mental freshness, which, at first very quickly and then more and more slowly, gives way to a certain mental fatigue. There are no limits, so to speak, to the slowing down of the learning processes caused by unusual distractions; as a result of these the time for learning a series may occasionally be increased to double that of its average value or more. The opposite effect, that of an unusual exertion, cannot in the very nature of the case overstep a certain limit. It can never reduce the learning time to zero.
If, however, groups of series equal in number and learned in immediate succession are taken, these disturbing influences may be considered to have disappeared or practically so. The decrease in mental vigour in one group will be practically the same as that in another. The positive and negative fluctuations of attention which under like conditions occur during a quarter or half hour are approximately the same from day to day. All that is necessary to ask, then, is: Do the times necessary for learning equal groups of series exhibit the desired distribution?
I can answer this question in the affirmative with sufficient certainty. The two longest series, obtained under conditions similar to each other, which I possess, are, to be sure, not large in the above-mentioned theoretical sense; they suffer, moreover, from the disadvantage that they originated at times separated by comparatively long intervals during which there were necessarily many changes in the conditions. In spite of this, their grouping comes as near as could be expected to the one demanded by the theory.
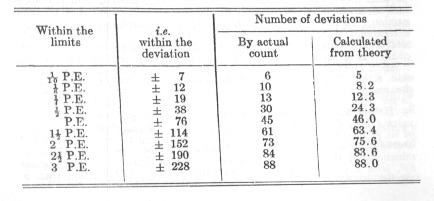
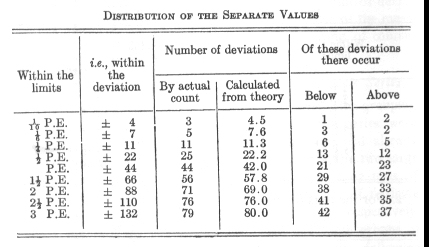
The first test series taken during the years 1879-80 comprises 92 tests. Each test consisted in memorising eight series of 13 syllables each, which process of learning was continued until two reproductions of each series were possible. The time required for all eight series taken together including the time for the two reproductions (but of course not for the pauses, see p. 25, 4) amounted to an average of 1,112 seconds with a probable error of observation of ± 76. The fluctuations of the results were, therefore, very significant: only half of the numbers obtained fell between the limits 1,036 and 1,188, the other half was distributed above and below these limits. In detail the grouping of the numbers is as follows:
In the interval, 1/4 P.E. to 1/2 P.E., there occurs a slight piling up of values which is compensated for by a greater lack in the succeeding interval, 1/2 P.E. to P.E. Apart from this, the correspondence between the calculated and the actual results is satisfactory. The symmetry of the distribution leaves something to be desired. The values below the average preponderate a little in number, those above preponderate a little in amount of deviation: only two of the largest eight deviations are below the mean value. The influence of attention referred to above, the fluctuations of which in the separate series show greater deviations toward the upper limit than toward the lower, has not, therefore, been quite compensated by the combination of several series.
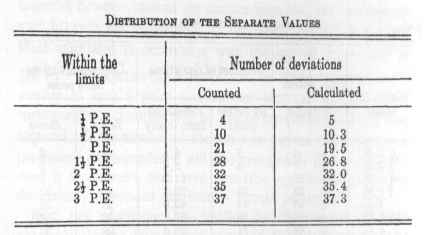
The correctness of the observations and the correspondence of their distributions with the one theoretically demanded are greatly improved in the second large series of tests. The latter comprises the results of 84 series of tests taken during the years 1883-84. Each test consisted in memorising six series of 16 syllables each, carried on in each case to the first errorless reproduction. The whole time necessary for this amounted to 1,261 seconds with the probable error of observation of ± 48.4 -- i.e., half of all the 84 numbers fell within the limits 1,213-1,309. The exactness of ths observations thus had greatly increased as compared with the former series of tests :[1]
The interval included by the probable error amounts to only 7 1/2 per cent of the mean values as against 14 per cent in the earlier tests. In detail the numbers are distributed as follows:
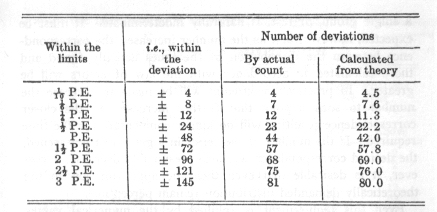
The symmetry of distribution is here satisfactorily maintained apart from the numbers, which are unimportant on account of their smallness.
The deviation which is greatest absolutely is toward the lower limit.
If several of our series of syllables were combined into groups and then memorised separately, the length of time necessary to memorise a whole group varied greatly, to be sure, when repeated tests were taken; but, in spite of this, when taken as a whole they varied in a manner similar to that of the measures of the ideally homogeneous processes of natural science, which also vary from each other. So, at least in experimental fashion, it is allowable to use the mean values obtained from the numerical results for the various tests in order to establish the existence of causal relations just as natural science does that by means of its constants.
The number of series of syllables which is to be combined into a single group, or test, is naturally indeterminate. It must be expected, however, that as the number increases, the correspondence between the distribution of the times actually found and those calculated in accordance with the law of errors will be greater. In practice the attempt will be made to increase the number to such a point that further increase and the closer correspondence resulting will no longer compensate for the time required. If the number of the series in a given test is lessened, the desired correspondence will also presumably decrease. However, it is desirable that even then the approximation to the theoretically demanded distribution remain perceptible.
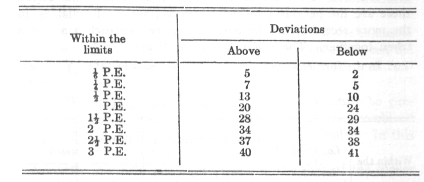
Even this requirement is fulfilled by the numerical values obtained. In the two largest series of tests just described, I have examined the varying length of time necessary for the memorisation of the first half of each test. In the older series, these are the periods required by each 4 series of syllables, in the more recent series the periods required by each 3 of them taken together. The results are as follows:
1. In the former series: mean value (m) = 533 (P.E.o) = ± 51.
2. In the later series: m = 620, P.E.o = ± 44.
By both tables the supposition mentioned above of the existence of a less perfect but still perceptible correspondence between the observed and calculated distribution of the numbers is well confirmed.
Exactly the same approximate correspondence must be presupposed if, instead of decreasing the number of series combined into a test, the total number of tests is made smaller. In this case also I will add some confirmatory summaries.
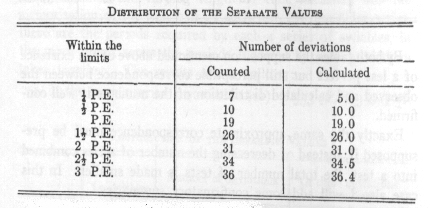
I possess two long test series, made at the time of the earlier tests, which were obtained under the same conditions as the above mentioned series but at the later times of the day, B. and C.
One of these, B, comprised 39 tests of 6 series each, the other, C, 38 tests of 8 series each, each series containing 13 syllables. The results obtained were as follows:
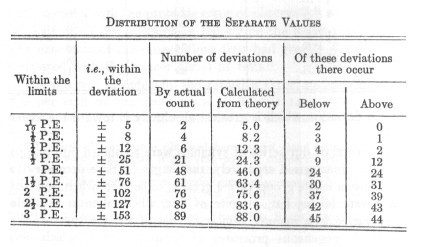
In addition I mention a series of only twenty tests, with which I shall conclude this summary. Each test consisted of the learning of eight separate series of thirteen syllables each, which had been memorised once one month before. The average was in this case 892 seconds with a probable error of observation of 54. The single values were grouped as follows:
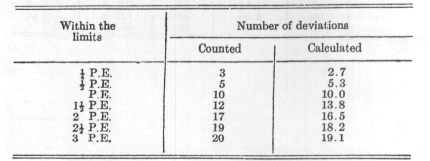
Although the number of the tests was so small, the accordance between the calculation by theory and the actual count of deviations is in all these cases so close that the usefulness of the mean values will be admitted, the wide limits of error being, of course, taken into consideration.
Section 18. Grouping of the Results of the Separate Series
The previously mentioned hypotheses concerning the grouping of the times necessary for learning the separate series were naturally not merely theoretical suppositions, but had already been confirmed by the groupings actually found. The two large series of tests mentioned above, one consisting of 92 tests of eight single series each, and the other of 84 tests of 6 single series each, thus giving 736 and 504 separate values respectively, afford a sufficiently broad basis for judgment. Both groups of numbers, and both in the same way, show the following peculiarities:
1. The distribution of the arithmetical values above their mean is considerably looser and extends farther than below the mean. The most extreme values above lie 2 times and 1.8 times, respectively, as far from the mean as the most distant of those below.
2. As a result of this dominance by the higher numbers the mean is displaced upward from the region of the densest distribution, and as a result the deviations below get the preponderance in number. There occur respectively 404 and 266 deviations below as against 329 and 230 above.
3. The number of deviations from the region of densest distribution towards both limits does not decrease uniformly -- as one would be very much inclined to expect from the relatively large numbers combined -- but several maxima and minima of density are distinctly noticeable. Therefore constant sources of error were at work in the production of the separate values -- i.e., in the memorisation of the separate series. These resulted on the one hand in an unsymmetrical distribution of the numbers, and on the other hand in an accumulation of them in certain regions. In accordance with the investigations already presented in this chapter, it can only be supposed that these influences compensated each other when the values of several series learned in succession were combined.
I have already mentioned as the probable cause of this unsymmetrical distribution the peculiar variations in the effect of high degrees of concentration of attention and distraction. It would naturally be supposed that the position of the separate series within each test is the cause of the repeated piling up of values on each side of the average. If, in the case of a large test-series, the values are summed up for the first, the second, and third series, etc., and the average of each is taken, these average values vary greatly, as might be expected. The separate values are grouped about their mean with only tolerable approximation to the law of error, but yet they are, on the whole, distributed most densely in its region, and these separate regions of dense distribution must of course appear in the total result.
The following may be added by way of supplement: on account of the mental fatigue which increases gradually during the course of a test-series the mean values ought to increase with the number of the series; but this does not prove to be the case.
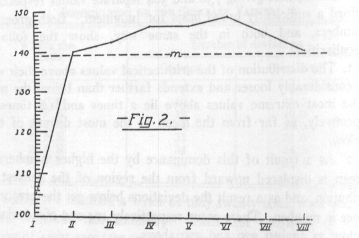
Only in one case have I been able to notice anything corresponding to this hypothesis, namely, in the large and therefore important series of 92 tests consisting of eight series of 13 syllables each. In this case the mean values for the learning of the 92 first series, the 92 second series, etc., were found to be 105, 140, 142, 146, 148, 140 seconds, the relative lengths of which Fig 2 exhibits. For all the rest of the cases which I investigated the typical fact is, on the contrary, rather suc ha course of the numbers as was true in the case of the series of 84 tests of six series of 16 syllables each and as is shown in Fig. 3.
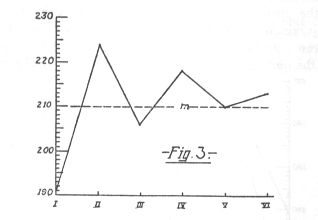
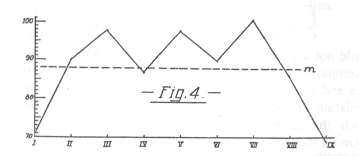
The mean values here were 191, 224, 206, 218, 210, 213 seconds. They start in, as may be seen, considerably below the average, but rise immediately to a height which is not again reached in the further course of the test, and they then oscillate rather decidedly. An analogous course is shown by the numbers in the 7 tests of nine 12-syllable series, namely: 71, 90, 98, 87, 98, 90, 101, 86, 69 (Fig. 4).
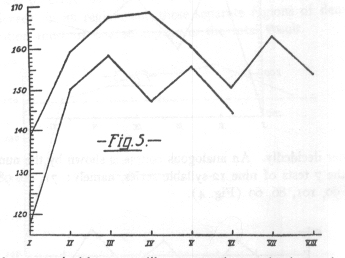
Furthermore the values for 39 tests of six series of 13 syllables each obtained in time B were as follows: 118, 150, 158, 147, 155, 144 (Fig. 5 lower curve).
Those for 38 tests with eight 13 syllable series of time C were 139,159,167, 168, 160, 150,162,153 (Fig. 5 upper curve).
Finally the numbers obtained from seven tests with six stanzas of Byron's "Don Juan" were: 189, 219, 171, 204 183, 229.
Even in the case of the first mentioned contradictory group of tests a grouping of the separate mean values harmonising with the normal one occurs if, instead of all the 92 tests being taken into consideration at once, they are divided into several parts -- i.e., if tests are combined which were taken at about the same time and under about the same conditions.
The conclusion cannot be drawn from these numerical results that the mental fatigue which gradually increased during the twenty minute duration of the tests did not exert any influence.
It can only be said that the supposed influence of the latter upon the numbers is far outweighed by another tendency which would not a priori be so readily suspected, namely the tendency of comparatively low values to be followed by comparatively high ones and vice versa. There seems to exist a kind of periodical oscillation of mental receptivity or attention in connection with which the increasing fatigue expresses itself by fluctuations around a median position which is gradually displaced.[2]
After orienting ourselves thus concerning the nature and value of the numerical results gained from the complete memorisations, we shall now turn to the real purpose of the investigation, namely the numerical description of causal relations.
Footnotes
An examination of the actual relations is, to be sure, a little difficult, but fully confirms the statements. In the 84 tests, consisting of six series of 16 syllables each, the [square root of] n = 2.45. We found 48.4 to be the probable error of observation of the 84 tests. The probable error of the 504 separate values is 31.6. The quotient 31.6: 48.4 is 1.53; therefore not quite 2/3 of the value of [the square root of] n.