 [p. 178]
An internet resource developed by
Christopher D. Green
York University, Toronto, Ontario
ISSN 1492-3173
(Return to index)
By Ronald A. Fisher (1925)
Posted April 2000
VII
INTRACLASS CORRELATIONS AND THE ANALYSIS OF VARIANCE
38. A type of data, which is of very common occurrence, may be treated by methods closely analogous to that of the correlation table, while at the same time it may be more usefully and accurately treated by the analysis of variance, that is by the separation of the variance ascribable to one group of causes, from the variance ascribable to other groups. We shall in this chapter treat first of those cases, arising in biometry, in which the analogy with the correlations treated in the last chapter may most usefully be indicated, and then pass to more general cases, prevalent in experimental results, in which the treatment by correlation appears artificial, and in which the analysis of variance appears to throw a real light on the problems before us. A comparison of the two methods of treatment illustrates the general principle, so often lost sight of, that tests of significance, in so far as they are accurately carried out, are bound to agree, whatever process of statistical reduction may be employed. [p. 177]
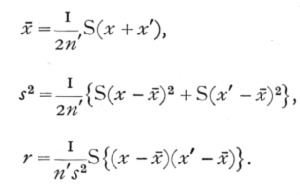
If we have measurements of n' pairs of brothers, we may ascertain the correlation between brothers in two slightly different ways. In the first place we may divide the brothers into two classes, as for instance elder brother and younger brother, and find the correlation between these two classes exactly as we do with parent and child. If we proceed in this manner we shall find the mean of the measurements of the elder brothers, and separately that of the younger brothers. Equally the standard deviations about the mean are found separately for the two classes. The correlation so obtained, being that between two classes of measurements, is termed for distinctness an interclass correlation. Such a procedure would be imperative if the quantities to be correlated were, for example, the ages, or some characteristic sensibly dependent upon age, at a fixed date. On the other hand, we may not know, in each case, which measurement belongs to the elder and which to the younger brother, or, such a distinction may be quite irrelevant to our purpose; in such cases it is usual to use a common mean derived from all the measurements, and a common standard deviation about that mean. If x1, x'1; x2, x'2; ...; xn'; x'n' are the pairs of measurements given, we calculate
 [p. 178]
When this is done, r is distinguished as an intraclass correlation, since we have treated all the brothers as belonging to the same class, and having the same mean and standard deviation. The intraclass correlation, when its use is justified by the irrelevance of any such distinction as age, may be expected to give a more accurate estimate of the true value than does any of the possible interclass correlations derived from the same material, for we have used estimates of the mean and standard deviation founded on 2n' instead of on n' values. This is in fact found to be the case; the intraclass correlation is not an estimate equivalent to an interclass correlation, but is somewhat more accurate. The error distribution is, however, as we shall see, affected also in other ways, which require the intraclass correlation to be treated separately.
The analogy of this treatment with that of interclass correlations may be further illustrated by the construction of what is called a symmetrical table. Instead of entering each pair of observations once in such a correlation table, it is entered twice, the co-ordinates of the two entries being, for instance (x1, x'1) and (x'1, x1). The total entries in the table will then be 2n', and the two marginal distributions will be identical, each representing the distribution of the whole 2n' observations. The above equations, for calculating the intraclass correlation, bear the same relation to the symmetrical table as the equations for the interclass correlation bear to the corresponding unsymmetrical table with n' entries. Although the intraclass correlation is somewhat the more accurate, [p. 179] it is by no means so accurate as is an interclass correlation with 2n' independent pairs of observations. The contrast between the two types of correlation becomes more obvious when we have to deal not with pairs, but with sets of three or more measurements; for example, if three brothers in each family have been measured. In such cases also a symmetrical table can be constructed. Each trio of brothers will provide three pairs, each of which gives two entries, so that each trio provides 6 entries in the table. To calculate the correlation from such a table is equivalent to the following equations:
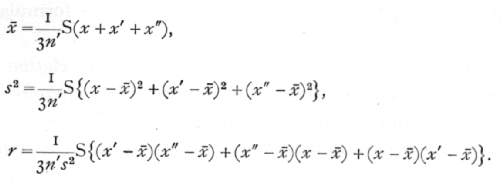
In many cases the number of observations in the same "fraternity" or class, is large, as when the resemblance between leaves on the same tree is studied by picking 26 leaves from a number of different trees, or when 100 pods are taken from each tree in another group of correlation studies. If k is the number in each class, then each set of k values will provide k(k-1) values for the symmetrical table, which thus may contain an enormous number of entries, and be very laborious to construct. To obviate this difficulty Harris introduced an abbreviated method of calculation by which the value of the [p. 180] correlation given by the symmetrical table may be obtained directly from two distributions: (i.) the distribution of the whole group of kn' observations, from which we obtain, as above, the values of x[bar] and s; (ii.) the distribution of the n' means of classes. If x[bar]1, x[bar]2, ..., x[bar]n represent these means each derived from k values, then
![]()
is an equation from which can be calculated the value of r, the intraclass correlation derived from the symmetrical table. It is instructive to verify this fact, for the case k=3, by deriving from it the full formula for r given above for that case.
One salient fact appears from the above relation; for the sum of a number of squares, and therefore the left hand of this equation, is necessarily positive. Consequently r cannot have a negative value less than -1/(k-1)There is no such limitation to positive values, all values up to +1 being possible. Further, if k, the number in any class, is not necessarily less than some fixed value, the correlation in the population cannot be negative at all. For example, in card games, where the number of suits is limited to four, the correlation between the number of cards in different suits in the same hand may have negative values down to -1/3; but there is probably nothing in the production of a leaf or a child which necessitates that the number in such a class should be less than any number however great, and in the absence of such a necessary restriction we cannot expect to find negative correlations [p. 181] within such classes. This is in the sharpest contrast to the unrestricted occurrence of negative values among interclass correlations, and it is obvious, since the extreme limits of variation are different in the two cases, that the distribution of values in random samples must be correspondingly modified.
39. Sampling Errors of Intraclass Correlations
The case k=2, which is closely analogous interclass correlation, may be treated by the formation previously employed, namely
z = 1/2{log (1+r) - log (1-r)};
z is then distributed very nearly in a normal distribution, the distribution is wholly independent of the value of the correlation r in the population from which the sample is drawn, and the variance of z consequently depends only on the size of the sample, being given by the formula

The transformation has, therefore, the same advantages in this case as for interclass correlations. It will be observed that the slightly greater accuracy of the intraclass correlation, compared to an interclass correlation based on the same number of pairs, is indicated by the use of n'-3/2 in place of n'-3. The advantage is, therefore, equivalent to 11/2 additional pairs of observations. A second difference lies in the bias to which such estimates are subject. For interclass [p. 182] correlations the value found in samples, whether positive or negative, is exaggerated to the extent of requiring a correction,

to be applied to the average value of z. With intraclass correlations the bias is always in the negative direction, and is independent of r; the correction necessary in these cases being  or approximately,
  This bias is characteristic of intraclass correlations for all values of k, and arises from the fact that the symmetrical table does not provide us with quite the best estimate of the correlation.
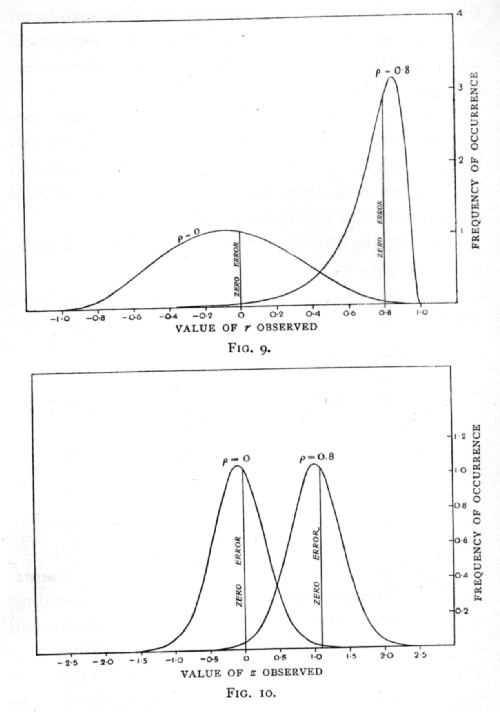
The effect of the transformation upon the error curves may be seen by comparing Figs. 9 and 10. Fig. 9 shows the actual error curves of r derived from a symmetrical table formed from 8 pairs of observations, drawn from populations having correlation o and 0·8. Fig. 10 shows the corresponding error curves for the distribution of z. The three chief advantages noted in Figs. 7 and 8 are equally visible in the comparison of Figs. 9 and 10. Curves of very unequal variance are replaced by curves of equal variance, skew curves by approximately normal curves, curves of dissimilar form by curves of similar form. In one respect the effect of the transformation is more perfect for the intraclass than it is for the interclass correlations, for, although in both cases the curves are not precisely [p. 183] normal, with the intraclass correlations they are entirely constant in variance and form, whereas with interclass correlations there is a slight variation in both [p. 184] respects, as the correlation in the population is varied. Fig. 10 shows clearly the effect of the bias introduced in estimating the correlation from the symmetrical table; the bias, like the other features of these curves, is absolutely constant in the scale of z.
Ex. 34· Accuracy of an observed intraclass correlation. -- An intraclass correlation .6000 is derived from 13 pairs of observations : estimate the correlation in the population from which it was drawn, and find the limits within which it probably lies.
Placing the values of r and z in parallel columns, we have
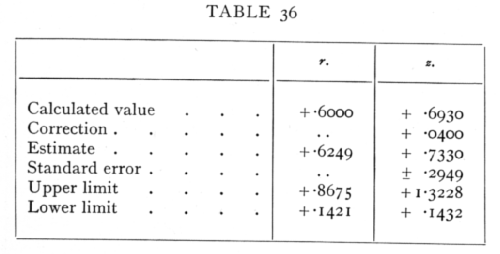
The calculation is carried through in the z column, and the corresponding values of r found as required from the Table V.(B) (p. 175). The value of r is obtained from the symmetrical table, and the corresponding value of z calculated. These values suffer from a small negative bias, and this is removed by adding to z the correction ; the unbiassed estimate of z is therefore .7330, and the corresponding value of r, .6249, is an unbiassed estimate, based upon the sample, of the correlation in the population from which the sample [p. 185] was drawn. To find the limits within which this correlation may be expected to lie, the standard error of z is calculated, and twice this value is added and subtracted from the estimated value to obtain the values of z at the upper and lower limits. From these we obtain the corresponding values of r. The observed correlation must in this case be judged significant, since the lower limit is positive; we shall seldom be wrong in concluding that it exceeds .14 and is less than .87·
The sampling errors of the cases in which k exceeds 2 may be more satisfactorily treated from the standpoint of the analysis of variance; but for those cases in which it is preferred to think in terms of correlation, it is possible to give an analogous transformation suitable for all values of k. Let

a transformation, which reduces to the form previously used when k=2. Then, in random samples of sets of k observations the distribution of errors in z is independent of the true value, and approaches normality as n' is increased, though not so rapidly as when k=2. The variance of z may be taken, when n' is sufficiently large, to be approximately

To find r for a given value of z in this transformation, Table V.(B) may still be utilised, as in the following example. [p. 186]
Ex. 35· Extended use of Table V.(B). -- Find the value of r corresponding to z = +1.0605, when k=100. First deduct from the given value of z half the natural logarithm of (k-1) ; enter the difference as "z" in the table and multiply the corresponding value of "r" by k; add k-2 and divide by 2(k-1). The numerical work is shown below:
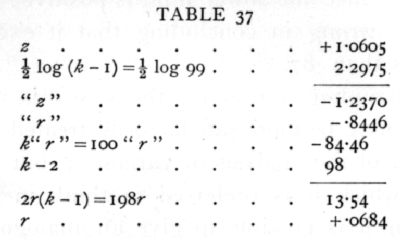
Ex. 36. Significance of intraclass correlation from large samples. -- A correlation +.0684 was found between the "ovules failing" in the different pods from the same tree of Cercis Canadensis. 100 pods were taken from each of 60 trees (Harris's data). Is this a significant correlation?
As the last example shows, z=I.0605; the standard error of z is .0933· The value of z exceeds its standard error over 11 times, and the correlation is undoubtedly significant.
When n' is sufficiently large we have seen that, subject to somewhat severe limitations, it is possible to assume that the interclass correlation is normally distributed in random samples with standard error
 [p. 187]
The corresponding formula for intraclass correlations, using k in a class, is

The utility of this formula is subject to even more drastic limitations than is that for the interclass correlation, for n' is more often small in the former case. In addition, the regions for which the formula is inapplicable, even when n' is large, are now not in the neighbourhood of [plus or minus]1, but in the neighbourhood of +1 and  When k is large the latter approaches zero, so that an extremely skew distribution for r is found not only with high correlations but also with very low ones. It is therefore not usually an accurate formula to use in testing significance. This abnormality in the neighbourhood of zero is particularly to be noticed, since it is only in this neighbourhood that much is to be gained by taking high values of k. Near zero, as the above formula shows, the accuracy of an intraclass correlation is with large samples equivalent to that of 1/2k(k-1)n' independent pairs of observations; which gives to high values of k an enormous advantage in accuracy. For correlations near .5, however great k be made, the accuracy is no higher than that obtainable from 9n'/2 pairs; while near +1 it tends to be no more accurate than would be n' pairs. [p. 188]
40. Intraclass Correlation as an Example of the Analysis of Variance
A very great simplification is introduced into questions involving intraclass correlation when we recognise that in such cases the correlation merely measures the relative importance of two groups of factors causing variation. We have seen that in the practical calculation of the intraclass correlation we merely obtain the two necessary quantities kn's2 and n's2{1+(k-1)r}, by equating them to the two quantities

of which the first is the sum of the squares (kn' in number) of the deviations of all the observations from their general mean, and the second is k times the sum of the squares of the n' deviations of the mean of each class from the general mean. Now it may easily be shown that

in which the last term is the sum of the squares of the deviations of each individual measurement from the mean of the class to which it belongs. The following table summarises these relations by showing the number of degrees of freedom involved in each case, and, in the last column, the interpretation put upon each expression in the calculation of an intraclass correlation to correspond to the value obtained from a symmetrical table. [p. 189]
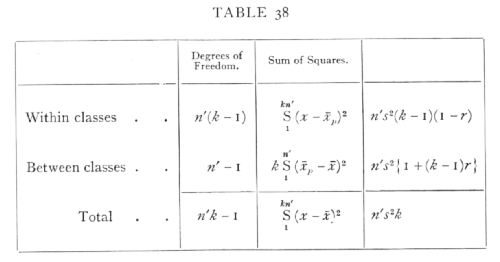
It will now be observed that z of the preceding section is, apart from a constant, half the difference of the logarithms of the two parts into which the sum of squares has been analysed. The fact that the form of the distribution of z in random samples is independent of the correlation of the population sampled, is thus a consequence of the fact that deviations of the individual observations from the means of their classes are independent of the deviations of those means from the general mean. The data provide us with independent estimates of two variances; if these variances are equal the correlation is zero; if our estimates do not differ significantly the correlation is insignificant. If, however, they are significantly different, we may if we choose express the fact in terms of a correlation.
The interpretation of such an inequality of variance in terms of a correlation may be made clear as follows, by a method which also serves to show that the interpretation made by the use of the symmetrical table is [p. 190] slightly defective. Let a quantity be made up of two parts, each normally and independently distributed; let the variance of the first part be A, and that of the second part, B ; then it is easy to see that the variance of the total quantity is A+B. Consider a sample of n' values of the first part, and to each of these add a sample of k values of the second part, taking a fresh sample of k in each case. We then have n' classics of values with k in each class. In the infinite population from which these are drawn the correlation between pairs of numbers of the same class will be

From such a set of kn' values we may make estimates of the values of A and B, or in other words we may analyse the variance into the portions contributed by the two causes; the intraclass correlation will be merely the fraction of the total variance due to that cause which observations in the same class have in common. The value of B may be estimated directly, for variation within each class is due to this cause alone, consequently

The mean of the observations in any class is made up of two parts, the first part with variance A, and a second part, which is the mean of k values of the second parts of the individual values, and has therefore a variance B/k; consequently from the observed [p. 191] variation of the means of the classes, we have

Table 38 may therefore be rewritten, writing in the last column s2 for A+B, and r for the unbiassed estimate of the correlation.
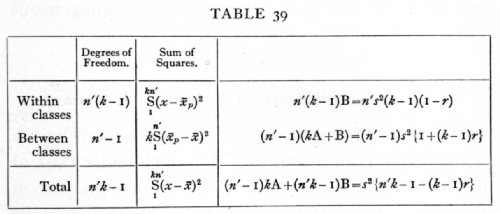
Comparing the last column with that of Table 38 it is apparent that the difference arises solely from putting n'-1 in place of n' in the second line; the ratio between the sums of squares is altered in the ratio n': (n'-1), which precisely eliminates the negative bias observed in z derived by the previous method. The error of that method consisted in assuming that the total variance derived from n' sets of related individuals could be accurately estimated by equating the sum of squares of all the individuals from their mean, to n's2k; this error is unimportant when n' is large, as it usually is when k=2, but with higher values of k, data may be of great value even when n' is very small, and in such cases serious discrepancies arise from the use of the uncorrected values. [p. 192]
The direct test of the significance of an intraclass correlation may be applied to such a table of the analysis of variance without actually calculating r. If there is no correlation, then A is not significantly different from zero; there is no difference between the several classes which is not accounted for, as a random sampling effect of the difference within each class. In fact the whole group of observations is a homogeneous group with variance equal to B.
41. Test of Significance of Difference of Variance
The test of significance of intraclass correlations is thus simply an example of the much wider class of tests of significance which arise in the analysis of variance. These tests are all reducible to the single problem of testing whether one estimate of variance derived from n1 degrees of freedom is significantly greater than a second such estimate derived from n2 degrees of freedom. This problem is reduced to its simplest form by calculating z equal to half the difference of the natural logarithms of the estimates of the variance, or to the difference of the, logarithms of the corresponding standard deviations. Then if P is the probability of exceeding this value by chance, it is possible to calculate the value of z corresponding to different values of P, n1, and n2.
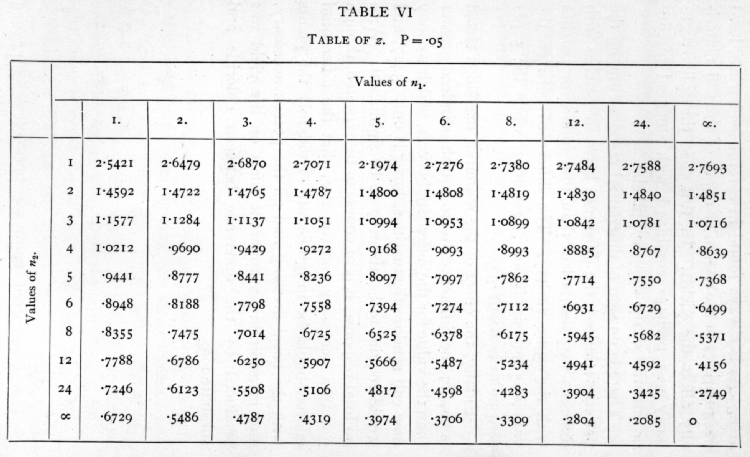
A full table of this kind, involving three variables, would be very extensive; we therefore give only a small table for P =·.05 and selected values of n1, and n2, which will be of immediate assistance in practical [p. 193] problems, but could be amplified with advantage (Table VI., p. 210). We shall give various examples of the use of this table, When both n1 and n2 are large, and also for moderate values when they are equal or nearly equal, the distribution of z is sufficiently nearly normal for effective use to be made of its standard deviation, which may be written

This includes the case of the intraclass correlation, when k=2, for if We have n' pairs of values, the variation between classes is based on n'-1 degrees of freedom, and that within classes is based on n' degrees of freedom, so that
n1 =n'-1, n2=n',
and for moderately large values of n' we may take z to be normally distributed as above explained. When k exceeds 2, We have
n1=n'-1, n2=(k-1)n';
these may be very unequal, so that unless n' be quite large, the distribution of z will be perceptibly asymmetrical, and the standard deviation will not provide a satisfactory test of significance.
Ex. 37· Sex difference in variance of stature. -- From 1164 measurements of males the sum of squares of the deviations was found to be 8493; while from 1456 measurements of females it was 9747: is there a significant difference in absolute variability? [p. 194]
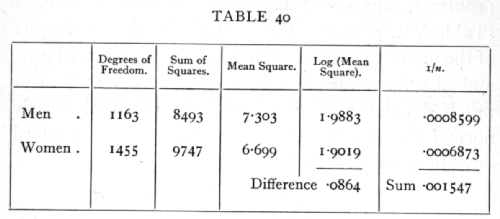
The mean squares are calculated from the sums of squares by dividing by the degrees of freedom; the difference of the logarithms is .0864, so that z is .0432.·The variance of z is half the sum of the last column, so that the standard deviation of z is .02781. The difference in variability, though suggestive of a real effect, cannot be judged significant on these data.
Ex. 38. Homogeneity of small samples. -- In an experiment on the accuracy of counting soil bacteria, a soil sample was divided into four parallel samples, and from each of these after dilution seven plates were inoculated. The number of colonies on each plate is shown below. Do the results from the four samples agree within the limits of random sampling? In other words, is the whole set of 28 values homogeneous, or is there any perceptible intraclass correlation? [p. 195]
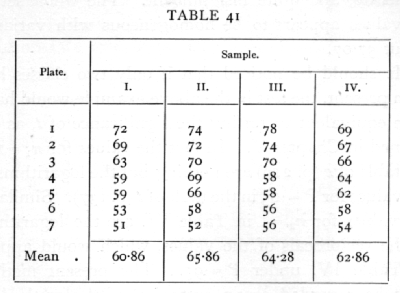
From these values we obtain
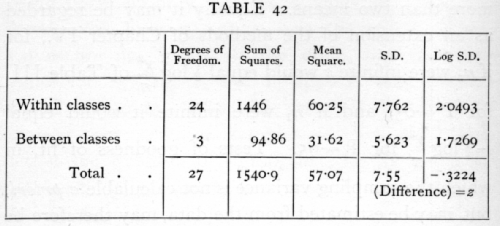
The variation within classes is actually the greater, so that if any correlation is indicated it must be negative. The numbers of degrees of freedom are small and unequal, so we shall use Table VI. This is entered with n1 equal to the degrees of freedom corresponding to the larger variance, in this case 24; n2=3. The table shows that P=.05 for z=1.078I, so that the observed difference, .3224, is really very [p. 196] moderate, and quite insignificant. The whole set of 28 values appears to be homogeneous with variance about 57.07.·
It should be noticed that if only two classes had been present, the test in the above example would have been equivalent to testing the significance of t, as explained in Chapter V. In fact the values for n1=1 in the table of z (p. 210) are nothing but the logarithms of the values for P=.05 in the table of t (p. 137)· Similarly the values for n2=1 in Table VI. are the logarithms of the reciprocals of the values, which would appear in Table IV. under P=.95· The present method may be regarded as an extension of the method of Chapter V., appropriate when we wish to compare more than two means. Equally it may be regarded as an extension of the methods of Chapter IV., for if n2 were infinite z would equal 1/2 logc2/n of Table III. for P=.05, and if n1 were infinite it would equal -1/2 logc2/n for P=.95. Tests of goodness of fit, in which the sampling variance is not calculable a priori, but may be estimated from the data, may therefore be made by means of Table VI.
Ex. 39· Comparison of intraclass correlations. -- The following correlations are given (Harris's data) for the number of ovules in different pods of the same tree, 100 pods being counted on each tree (Cercis Canadensis):
|
Meramec Highlands |
60 trees |
+.3527 |
|
Lawrence, Kansas |
22 trees |
+.3999 |
[p. 197]
Is the correlation at Lawrence significantly greater than that in the Meramec Highlands?
First we find z in each case from the formula
z = 1/2{log(1+99r) - log(1-r)}
(p. 185); this gives z=2.0081 for Meramec and 2.1071 for Lawrence; since these were obtained by the method of the symmetrical table we shall insert the small correction 1/(2n'-1) and obtain 2.0165 for Meramec, and 2.1506 for Lawrence, as the values which would have been obtained by the method of the analysis of variance.
To ascertain to what errors these determinations are subject, consider first the case of Lawrence, which being based on only 22 trees is subject to the larger errors. We have n1=21, n2=22x99=2178· These values are not given in the table, but from the value for n1=24, n2=[infinity] it appears that positive errors exceeding .2085 will occur in rather more than 5 per cent of samples. This fact alone settles the question of significance, for the value for Lawrence only exceeds that obtained for Meramec by .1341.·
In other cases greater precision may be required. In the table for z the five values 6, 8, 12, 24, [infinity] are chosen for being in harmonic progression, and so facilitating interpolation, if we use 1/n as the variable. If we have to interpolate both for n1 and n2, we proceed in three steps. We find first the values of z for n1=12, n2=2178, and for n1=24, n2=2178, and from these obtain the required value for n1=21, n2=2178. [p. 198]
To find the value for n1=12, n2=2178, observe that

for n2=[infinity] we have .2804, and for n2=24 a value higher by .1100, so that .2804+.0110x.1100=2816 gives the approximate value for n2=2178.
Similarly for n1=24
.2085+.0110x.1340=.2100.
From these two values we must find the value for n1=21; now
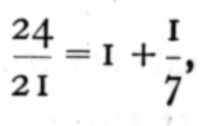
so that we must add to the value for n1=24 one-seventh of its difference from the value for n1= 2; this gives

which is approximately the positive deviation which would be exceeded by chance in 5 per cent of random samples.
Just as we have found the 5 per cent point for positive deviations, so the 5 per cent point for negative deviations may be found by interchanging n1 and n2; this turns out to be .2957· If we assume that our observed value does not transgress the 5 per cent point in either deviation, that is to say that it lies in the central nine-tenths of its frequency distribution, we may say that the value of z for Lawrence, Kansas, lies between 1.9304 and 2.4463; these values being found [p. 199] respectively by subtracting the positive deviations and adding the negative deviation to the observed value.
The fact that the two deviations are distinctly unequal, as is generally the case when n1 and n2 are unequal and not both large, shows that such a case cannot be treated accurately by means of a probable error.
Somewhat more accurate values than the above may be obtained by improved methods of interpolation; the above method will, however, suffice for all ordinary requirements, except in the corner of the table where both n1 and n2 exceed 24. For cases which fall into this region, the following formula gives the 5 per cent point within one-hundredth of its value. If h is the harmonic mean of n1 and n2, so that

then

Let us apply this formula to the above values for the Meramec Highlands, n1=59, n2=5940; the calculation is as follows:
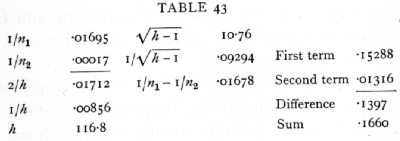
The 5 per cent point for positive deviations is therefore .1397, and for negative deviations .1660; [p. 200] with the same standards as before, therefore, we may say that the value for Meramec lies between 1.8768 and 2.1825; the large overlap of this range with that of Lawrence shows that the correlations found in the two districts are not significantly different.
42. Analysis of Variance into more than Two Portions
It is often necessary to divide the total variance into more than two portions; it sometimes happens both in experimental and in observational data that the observations may be grouped into classes in more than one way; each observation belongs to one class of type A and to a different class of type B. In such a case we can find separately the variance between classes of type A and between classes of type B; the balance of the total variance may represent only the variance within each subclass, or there may be in addition an interaction of causes, so that a change in class of type A does not have the same effect in all B classes. If the observations do not occur singly in the subclasses, the variance within the subclasses may be determined independently, and the presence or absence of interaction verified. Sometimes also, for example, if the observations are frequencies, it is possible to calculate the variance to be expected in the subclasses.
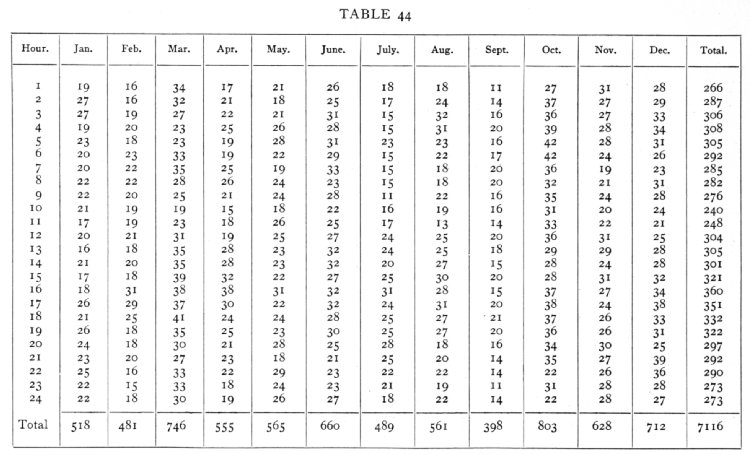
Ex. 40. Diurnal and annual variation of rain frequency. -- The following frequencies of rain at different hours in different months were observed at Richmond during 10 years (quoted from Shaw, with two corrections in the totals). [p. 201]
;[p. 202]
The variance may be analysed as follows:
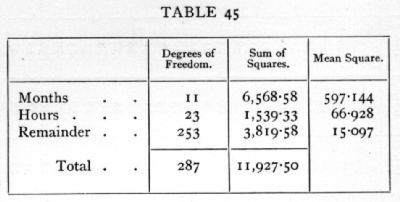
The mean of the 288 values given in the data is 24.7, and if the original data had represented independent sampling chances, we should expect the mean square residue to be nearly as great as this or greater, if the rain distribution during the day differs in different months. Clearly the residual variance is subnormal, and the reason for this is obvious when we consider that the probability that it should be raining in the 2nd hour is not independent of whether it is raining or not in the 1st hour of the same day. Each shower will thus probably have been entered several times, and the values for neighbouring hours in the same month will be positively correlated. Much of the random variation has thus been included in that ascribed to the months, and probably accounts for the very irregular sequence of the monthly totals. The variance between the 24 hours is, however, quite significantly greater than the residual variance, and this shows that the rainy hours have been on the whole similar in the different months, so that the figures clearly indicate the influence of time of day. [p. 203] From the data it is not possible to estimate the influence of time of year, or to discuss whether the effect of time .of day is the same in all months.
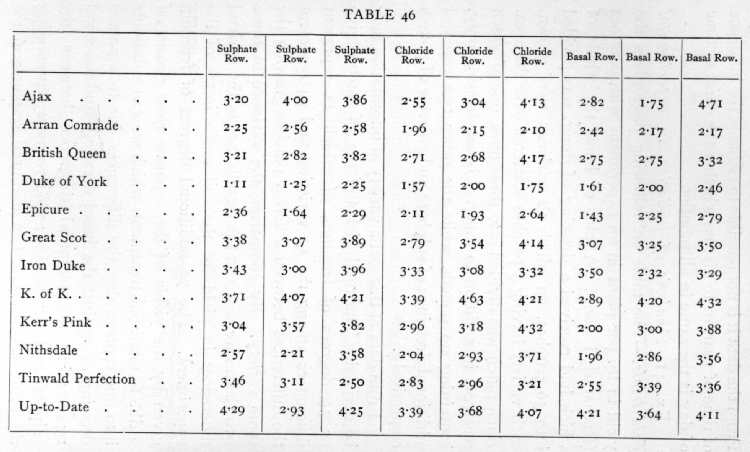
Ex. 41· Analysis of variation in experimental field trials. -- The table on following page gives the yield in lb. per plant in an experiment with potatoes (Rothamsted data). A plot of land, the whole of which had received a dressing of dung, was divided into 36 patches, on which 12 varieties were grown, each variety having 3 patches scattered over the area. Each patch was divided into three lines, one of which received, in addition to dung, a basal dressing only, containing no potash, while the other two received additional dressings of sulphate and chloride of potash respectively.
From data of this sort a variety of information may be derived. The total yields of the 36 patches give us 35 degrees of freedom, of which 11 represent differences among the 12 varieties, and 24 represent the differences between different patches growing the same variety. By comparing the variance in these two classes we may test the significance of the varietal differences in yield for the soil and climate of the experiment. The 72 additional degrees of freedom given by the yields of the separate rows consist of 2 due to manurial treatment, which we can subdivide into one representing the differences due to a potash dressing as against the basal dressing, and a second representing the manurial difference between the sulphate and the chloride; and 70 more representing the differences observed in manurial response in the [p. 204] [Table 46] [p 205] different patches. These latter may in turn be divided into 22 representing the difference in manurial response of the different varieties, and 48 representing the differences in manurial response in different patches growing the same variety. To test the significance of the manurial effects, we may compare the variance in each of the two manurial degrees of freedom with that in the remaining 70; to test the significance of the differences in varietal response to manure, we compare the variance in the 22 degrees of freedom with that in the 48; while to test the significance of the difference in yield of the same variety in different patches, we compare the 24 degrees of freedom representing the differences in the yields of different patches growing the same variety with the 48 degrees representing the differences of manurial response on different patches growing the same variety.
For each variety we shall require the total yield for the whole of each patch, the total yield for the 3 patches and the total yield for each manure; we shall also need the total yield for each manure for the aggregate of the It varieties; these values are given below (Table 47)·[p. 206]
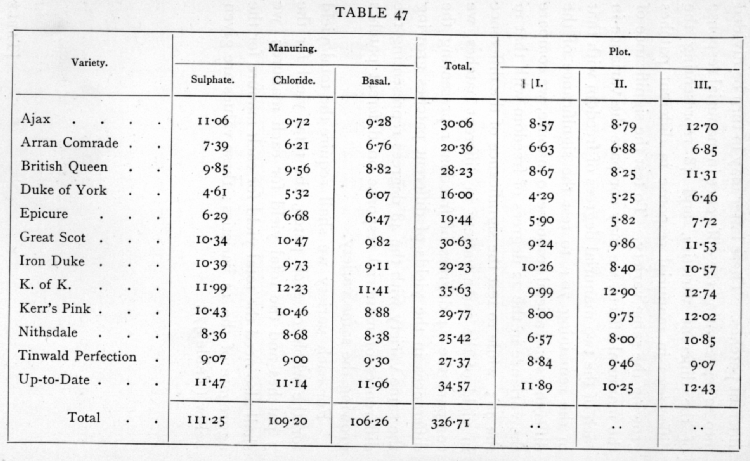
[p. 207]
The sum of the squares of the deviations of all the 108 values from their mean is 71.699; divided, according to patches, in 36 classes of 3, the value for the 36 patches is 61.078; dividing this again according to varieties into 12 classes of 3, the value for the 12 varieties is 43.638· We may express the facts so far as follows :
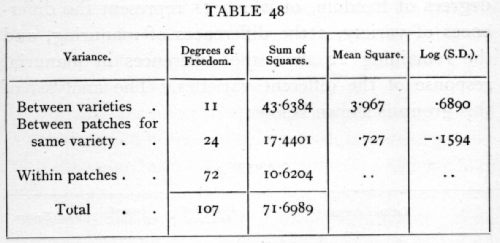
The value of z, found as the difference of the logarithms in the last column, is nearly 85, or more than twice the 5 per cent value; the effect of variety is therefore very significant.
Of the variation within the patches the portion ascribable to the two differences of manurial treatment may be derived from the totals for the three manurial treatments. The sum of the squares of the three deviations, divided by 36, is .3495 ; of this the square of the difference of the totals for the two potash dressings, divided by 72, contributes .0584, while the square of the difference between their mean and the total for the basal dressing, divided by 54, gives the remainder, .2913. It is possible, however, that the [p. 208] whole effect of the dressings may not appear in these figures, for if the different varieties had responded in different ways, or to different extents, to the dressings, the whole effect would not appear in the totals. The seventy remaining degrees of freedom would not be homogeneous. The 36 values, giving the totals for each manuring and for each variety, give us 35 degrees of freedom, of which 11 represent the differ- ences of variety, 2 the differences of manuring, and the remaining 22 show the differences in manurial response of the different varieties. The analysis of this group is shown below:
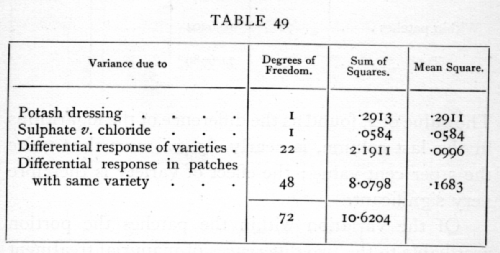
To test the significance of the variation observed in the yield of patches bearing the same variety, we may compare the value .727 found above from 24 degrees of freedom, with .1683 just found from 48 degrees. The value of z, half the difference of the logarithms, is .7316, while the 5 per cent point from the table of z is about .28. The evidence for unequal fertility of the different patches is therefore unmistakable. [p. 209] As is always found in careful field trials, local irregularities in the nature or depth of the soil materially affect the yields. In this case the soil irregularity was perhaps combined with unequal quality or quantity of the dung supplied.
There is no sign of differential response among the varieties; indeed, the difference between patches with different varieties is less than that found for patches with the same variety. The difference between the values is not significant; z=.2623, while the 5 per cent point is about .33·
Finally, the effect of the manurial dressings tested is small; the difference due to potash is indeed greater than the value for the differential effects, which we may now call random fluctuations, but z is only .3427, and would require to be about .7 to be significant. With no total response, it is of course to be expected, though not as a necessary consequence, that the differential effects should be insignificant. Evidently the plants with the basal dressing had all the potash necessary, and in addition no apparent effect on the yield was produced by the difference between chloride and sulphate ions. [p. 210]
